UK Self Storage Occupancy and Price per Sq Ft: Ten Years of Data
Big Yellow, Safestore, Lok’nStore and the SSA UK annual industry report each publish occupancy and price per square foot on their own basis and year end, and none joins the others. As at 17 October 2026 this guide sets out each source’s years in its own panel, marks where we found its basis changed and shows the survey printing different values for the same earlier years. It is general information, not a forecast.

By Phil McParlane, Founder
Published 17 October 202620 min read
- Occupancy in the latest year is lower than in 2021 for Big Yellow, for Safestore’s UK stores (on maximum lettable area) and for the SSA UK survey (all stores), and each counts its own stores on its own divisor and year end.
- The series break: Big Yellow’s FY22 column adds 24 Armadillo stores, Safestore’s FY18 count adds 12 Alligator stores, and Safestore’s FY25 announcement leads with current lettable area, so the same UK stores read 77.2% or 79.6% for FY24.
- The SSA UK annual industry report printed an all-store occupancy of 83.3% for 2022 and then 80.0% for the same year in its next edition; on 17 October 2026 the only note we found that says why is in its 2024 edition.
- Lok’nStore printed growth rates for FY18 to FY20 and levels on different bases for FY21 to FY23; on 17 October 2026 its archive page lists no annual report after the one for the year to 31 July 2023.
- This guide reads a run of years only inside one source, one perimeter of stores and one definition. This guide joins no two sources into one line and makes no forecast.
On this page
As at 17 October 2026, Big Yellow’s self storage occupancy, its occupied space divided by its maximum lettable area (our calculation), was 78.0% at 31 March 2017, a peak of 85.2% at 31 March 2021 and 74.2% at 31 March 2026. Its closing price per square foot rose from £26.03 to £36.28. Safestore’s UK average storage rate was £24.42 for the year to 31 October 2017 and £30.68 for 2025.
The SSA UK annual industry report printed 83.3% for 2022 and 80.0% for the same year in its next edition. Both are all-store occupancy from its operator survey. Both are the survey’s all-store occupancy. Across sources the measures are not interchangeable: each source counts its own stores on its own divisor and year end. This guide is general information about published figures, not financial or investment advice, and not a forecast. It shows each source’s years separately.
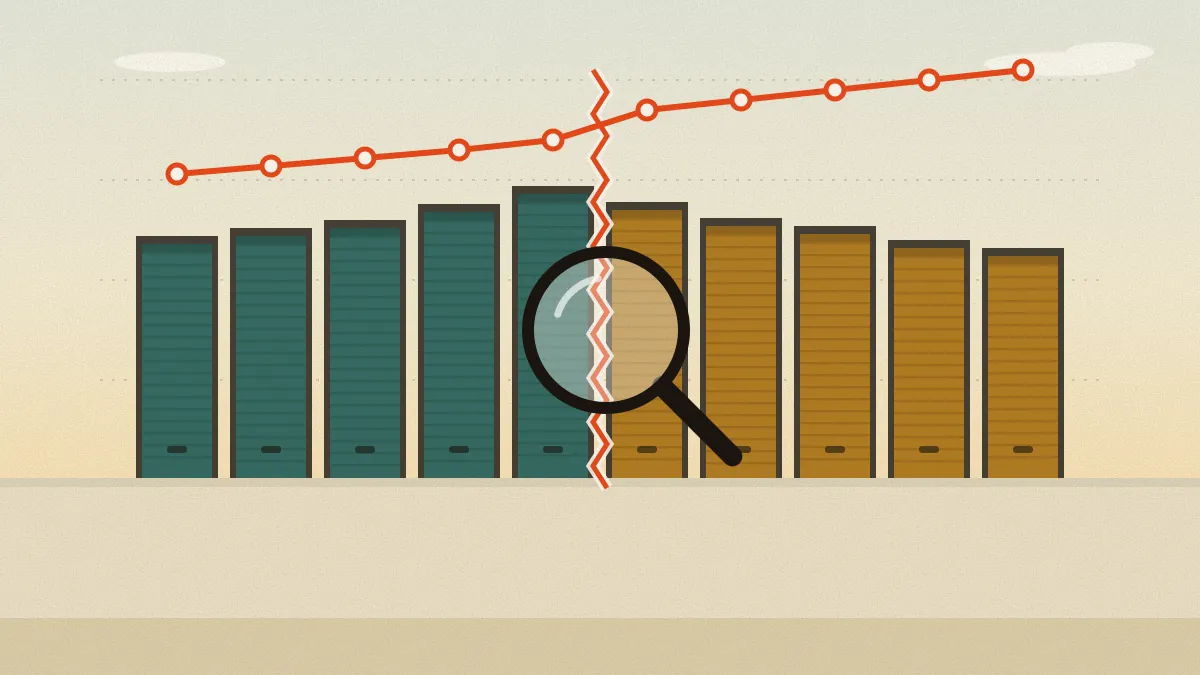
Each run in the first paragraph crosses a change in the stores counted: Big Yellow’s FY22 column adds 24 Armadillo stores and Safestore’s FY18 count adds 12 Alligator stores. This guide marks the breaks it found.
What are the headline moves in occupancy and price, source by source?
Each tile in the band below is one source’s own figure on its own basis and year end. Big Yellow’s are closing figures at 31 March, Safestore’s are UK figures for the year to 31 October, and the two from the SSA UK annual industry report are for the calendar year 2025. This guide calls none of them a UK average.
Big Yellow and Safestore describe their own estates, and the SSA describes a survey of operators. No two sources end their year on the same date, so a figure from one source is not comparable with a figure from another.
Where the text says FY26, it means the source’s own financial year: the year to 31 March 2026 for Big Yellow, the year to 31 October for Safestore and the year to 31 July for Lok’nStore. For the latest-year headline numbers, see our UK self storage industry statistics page.
Big Yellow closing occupancy at 31 March 2026, our calculation, on its own basis
74.2%
78.0% at 31 March 2017 and a peak of 85.2% at 31 March 2021; the FY22 column adds 24 Armadillo stores
Big Yellow closing price per square foot at 31 March 2026, on its own basis
£36.28
£26.03 at 31 March 2017, up 39.4% (our calculation), across the FY22 addition of 24 regional stores
Safestore UK average storage rate for the year to 31 October 2025, on its own basis
£30.68
£24.42 for FY17, up 25.6% (our calculation), across the 12 Alligator stores
Safestore UK closing occupancy of maximum lettable area at 31 October 2025, on its own basis
75.6%
79.9% of current lettable area on the same day; this guide does not join the two
SSA UK all-store occupancy for 2025, the 2026 edition’s text, on its own basis
74.5%
73.9% for 2016 and 83.3% for 2021 in the same text; earlier editions printed other values for some years
SSA UK revenue per square foot ex VAT for 2025, 2026 edition, on its own basis
£27.40
£28.87 for 2024 in the same report, which prints the 2025 fall as 5.1%, 5.4% and, in its regional section, 7.4% to £26.97
Big Yellow Group, results for the year to 31 March 2026 (18 May 2026); Safestore Holdings, results announcements for the years to 31 October 2017 and 2025; SSA UK annual industry report, 2026 edition. Percentage rises are our calculation. Read 17 October 2026.
What has UK self storage occupancy done over ten years, by source?
Occupancy in the latest year is lower than in 2021 for Big Yellow, for Safestore’s UK stores (on maximum lettable area) and for the SSA UK survey (all stores), each on its own basis.
Four sources print occupancy, each on its own basis: Big Yellow by area at 31 March, Safestore on maximum lettable area and then current lettable area, the SSA UK survey on lettable area (current, where the edition says so), and Lok’nStore in forms that change over the years.
Big Yellow: occupancy at 31 March
Big Yellow’s ten-year summary prints stores open, store maximum lettable area (MLA) and square feet occupied for each year to 31 March. On 17 October 2026 we found no occupancy-percentage row in that summary, on its investor page or on page 63 of its results for the year to 31 March 2026.
Big Yellow defines closing occupancy as the space occupied by customers divided by MLA at the balance sheet date, so we divide its two rows (our calculation). For 31 March 2026 that is 4,985 thousand sq ft occupied over 6,721 thousand of MLA, or 74.2%. For 31 March 2021 it is 4,201 over 4,930, or 85.2%, and for 31 March 2017 it is 3,551 over 4,551, or 78.0%.
In nine of the ten years our figure equals the percentage that Big Yellow’s own report prints for the year. The exception is FY18. The FY18 report printed 81.0% on total capacity of 4,606,000 sq ft. The FY19 report gave the FY18 capacity as 4,631,000 sq ft and the occupancy as 80.5%, with 3,730,000 sq ft occupied in both.
| Category | Closing occupancy (our calculation) |
|---|---|
| Year to 31 March 2017 | 78.0 |
| Year to 31 March 2018 | 80.5 |
| Year to 31 March 2019 | 82.4 |
| Year to 31 March 2020 | 80.7 |
| Year to 31 March 2021 | 85.2 |
| Year to 31 March 2022 | 83.7 |
| Year to 31 March 2023 | 80.9 |
| Year to 31 March 2024 | 78.3 |
| Year to 31 March 2025 | 78.7 |
| Year to 31 March 2026 | 74.2 |
Big Yellow Group, results for the year to 31 March 2026 (18 May 2026), ten-year summary: square feet occupied divided by store maximum lettable area. The FY18 report printed 81.0%, and the FY19 report gave 80.5% for FY18 on a different capacity; FY22 adds 24 Armadillo stores. Read 17 October 2026.
The FY22 column is the first to include the 24 Armadillo stores, whose remaining 80% Big Yellow acquired on 1 July 2021. Stores open went from 78 to 105 and MLA from 4,930 to 6,098 thousand sq ft. The table shows occupied space up 906 thousand sq ft that year.
Big Yellow’s own table of all 105 stores, which counts the Armadillo stores in the earlier year as well, shows a fall of 2 thousand (5,107 against 5,109), so about 908 thousand sq ft of the step is the consolidation (our calculation).
The FY23 column includes a 53,000 sq ft store in Aberdeen, acquired with 39,000 sq ft occupied.
Safestore UK: occupancy to 31 October
Safestore’s results announcements give UK closing occupancy of MLA for each year to 31 October from FY17 to FY24, with FY16 as the prior-year column of the FY17 announcement. The FY25 announcement leads with current lettable area (CLA), which leaves out space not yet fitted out and space that is operationally unavailable. It also prints the MLA figure for the UK in a table by geography, so FY25 is shown on both bases.
On 17 October 2026 we found no UK-only occupancy percentage and no UK average storage rate in pounds in the visible text of Safestore’s Five Year Record, Financial Highlights and Key Performance Indicators pages, so this series comes from its results announcements.
| Category | Occupancy of maximum lettable area |
|---|---|
| Year to 31 October 2016 | 69.7 |
| Year to 31 October 2017 | 71.6 |
| Year to 31 October 2018 | 72.9 |
| Year to 31 October 2019 | 76.9 |
| Year to 31 October 2020 | 79.4 |
| Year to 31 October 2021 | 85.4 |
| Year to 31 October 2022 | 82.6 |
| Year to 31 October 2023 | 78.1 |
| Year to 31 October 2024 | 77.2 |
| Year to 31 October 2025 | 75.6 |
Safestore Holdings, results announcements for the years to 31 October 2017 to 2025; FY16 is the prior-year column of the FY17 announcement. FY25 is the maximum lettable area figure from the geography table; the 79.9% of current lettable area that Safestore leads with is not drawn here. Read 17 October 2026.
| Financial year (to 31 October) | On maximum lettable area | On current lettable area | Gap in points (our calculation) |
|---|---|---|---|
| FY24 | On maximum lettable area77.2% | On current lettable area79.6% | Gap in points (our calculation)2.4 |
| FY25 | On maximum lettable area75.6% | On current lettable area79.9% | Gap in points (our calculation)4.3 |
The table gives the same UK stores on the same day on two divisors, so the gap is the divisor and not a market move. The FY17 count of 108 UK stores leaves out the 12 Alligator stores that Safestore acquired on 1 November 2017, the day after its year end. The FY18 count is 119 stores, and MLA rose from 4.54 million to 5.12 million sq ft.
The SSA UK annual industry report: all-store occupancy
The SSA’s all-store figure comes from a survey of operators, and its 2026 edition gives it on current lettable area. The 2026 edition’s own text gives 73.9% for 2016, 83.3% for 2021 and 74.5% for 2025. That is 0.6 points above 2016 and 8.8 points below 2021 (our calculation). Earlier editions printed other values for some of those years, so this guide reads a run of years from one edition at a time.
Lok’nStore: what each report printed
The reports and presentations archive page lists Lok’nStore’s annual reports from 2004 to 2023. Its reports for the years to 31 July 2018 to 2023 print occupancy and price in forms that change over the years. The table gives what each printed.
| Year to 31 July | Occupancy as printed | Price as printed | What the occupancy figure counts |
|---|---|---|---|
| 2018 | Occupancy as printedUnit occupancy up 7.7% | Price as printedUnit pricing up 0.5% | What the occupancy figure countsA growth rate; no level printed |
| 2019 | Occupancy as printedUnit occupancy up 6.0% | Price as printedUnit pricing up 0.6% | What the occupancy figure countsA growth rate; no level printed |
| 2020 | Occupancy as printedUnit occupancy up 5.9% | Price as printedUnit pricing level (broadly unchanged) | What the occupancy figure countsA growth rate; no level printed |
| 2021 | Occupancy as printedOccupancy up from 69.6% to 85.8% | Price as printedUnit pricing up 8.7% | What the occupancy figure countsA level; its basis is not printed beside it |
| 2022 | Occupancy as printedTwo thirds of stores over 80% occupied at year end | Price as printedAchieved rate on occupied space up 13% to £25.6 per sq ft | What the occupancy figure countsA share of stores, not a level |
| 2023 | Occupancy as printedClosing occupancy in stores over 3 years old 80.6% (2022: 82.9%) | Price as printedPricing up 6.8% to £27.37 per sq ft (2022: £25.62) | What the occupancy figure countsStores over three years old only |
The FY21 report also prints “Occupied space up 35.3% (2020: 5.9%)”, the same 5.9% that the FY20 report gives for unit occupancy. On 17 October 2026 we found that the FY23 report prints no closing occupancy level for all of Lok’nStore’s stores. Its 80.6% leaves out the 108,890 sq ft of new space added in the year.
On 17 October 2026 the archive page lists no annual report after the one for the year to 31 July 2023. On 17 October 2026 it also lists no interim report or investor presentation dated after 2023.
What has price per square foot done over ten years, by source?
Big Yellow’s closing price per square foot rose from £26.03 at 31 March 2017 to £36.28 at 31 March 2026, up 39.4% (our calculation: 36.28 divided by 26.03), across the addition of 24 regional stores in FY22.
Big Yellow: closing price per square foot
Big Yellow’s own label for the measure is “closing net rent per sq ft”. It is annual storage revenue from in-place customers divided by occupied space at the balance sheet date, and the ten-year summary prints it for each 31 March. This guide uses the closing figure. Big Yellow’s average for the year is a second measure: £35.98 for FY26 against £36.28 closing.
| Category | Closing price per square foot |
|---|---|
| Year to 31 March 2017 | 26.03 |
| Year to 31 March 2018 | 26.74 |
| Year to 31 March 2019 | 27.28 |
| Year to 31 March 2020 | 28.15 |
| Year to 31 March 2021 | 28.71 |
| Year to 31 March 2022 | 29.92 |
| Year to 31 March 2023 | 32.48 |
| Year to 31 March 2024 | 34.14 |
| Year to 31 March 2025 | 35.17 |
| Year to 31 March 2026 | 36.28 |
Big Yellow Group, results for the year to 31 March 2026 (18 May 2026), ten-year summary. FY22 rose 4% for all stores and 11% like-for-like, which leaves out the Armadillo stores. Read 17 October 2026.
The nine-year move crosses a break. In FY22 the closing price rose 4% for all stores, from £28.71 to £29.92, and 11% for like-for-like stores, from £28.84 to £31.91 (our calculation from the levels: 4.2% and 10.6%). The like-for-like set leaves out the Armadillo stores and recent openings.
Big Yellow’s footnote says the all-store rise is lower because of the regional Armadillo stores. At 31 March 2026 the price was £24.88 for those 24 stores and £38.80 for the 77 stores Big Yellow calls same stores.
Safestore UK: average storage rate
Safestore defines its average storage rate as revenue from self-storage divided by the average square feet occupied in the period. The table gives the UK rate for each year to 31 October, the change Safestore reported and its like-for-like change.
| Financial year (to 31 October) | Average storage rate | Change as reported | Like-for-like change |
|---|---|---|---|
| FY16 | Average storage rate£24.60 | Change as reportednot read | Like-for-like changenot read |
| FY17 | Average storage rate£24.42 | Change as reporteddown 0.7% | Like-for-like changeup 0.9% |
| FY18 | Average storage rate£23.66 | Change as reporteddown 3.1% | Like-for-like changeup 0.5% |
| FY19 | Average storage rate£23.93 | Change as reportedup 1.1% | Like-for-like changeup 1.4% |
| FY20 | Average storage rate£24.37 | Change as reportedup 1.8% | Like-for-like changeup 1.8% |
| FY21 | Average storage rate£25.32 | Change as reportedup 3.9% | Like-for-like changeup 4.5% |
| FY22 | Average storage rate£28.79 | Change as reportedup 13.7% | Like-for-like changeup 13.9% |
| FY23 | Average storage rate£30.25 | Change as reportedup 5.1% | Like-for-like changeup 5.1% |
| FY24 | Average storage rate£29.94 | Change as reporteddown 1.0% | Like-for-like changedown 0.6% |
| FY25 | Average storage rate£30.68 | Change as reportedup 2.5% | Like-for-like changeup 2.5% |
Safestore attributes the FY17 fall to immature new stores, and the FY18 fall “due to the dilutive impact of acquired Alligator stores”. Its like-for-like set rose 0.9% and 0.5% in those years. That set changes each year, so we do not chain the changes into one line. By our calculation Safestore’s average storage rate is up 25.6% from £24.42 for FY17 to £30.68 for FY25, and up 29.7% from £23.66 for FY18, the first year with the Alligator stores.
The SSA UK annual industry report: price per square foot
Inside its 2023 edition, the SSA’s UK price per square foot is £22.68 for 2016 and £27.19 for 2022, up 19.9% (our calculation). The next edition printed £25.97 for 2022, as the section below on the survey’s own figures shows. On 17 October 2026 we found no statement in the captured text of the 2026 edition that its £27.40 for 2025 is measured on occupied space, or on any other named area.
VAT was introduced on self storage from 1 October 2012, according to Big Yellow’s report for the year to 31 March 2021. The SSA states that its price data excludes VAT in its 2014, 2021, 2022, 2023, 2025 and 2026 editions, and on 17 October 2026 we found no such statement in its 2015 to 2020 editions or its 2024 edition.
On 17 October 2026 the definitions we read for Big Yellow’s and Safestore’s measures state no VAT basis, and we did not check the rest of their reports.
Year-end figures hide movement inside the year. Our seasonality guide charts when one listed operator’s space was let and handed back, month by month. For how an operator sets its own street rates, see our pricing strategy guide; this page covers published figures only.
Why do Big Yellow, Safestore and the industry survey give different numbers?
They divide by different areas, count different stores and end their years on different dates, so each figure answers a slightly different question. The table sets out the definitions as each source gives them.
| Source | Occupancy measure | Price measure | Year end |
|---|---|---|---|
| Big Yellow | Occupancy measureOccupied space over maximum lettable area | Price measureAnnual storage revenue over occupied space, at the year end | Year end31 March |
| Safestore UK | Occupancy measureOver maximum lettable area; over current lettable area from FY25 | Price measureSelf-storage revenue over average occupied space in the year | Year end31 October |
| Lok’nStore | Occupancy measureGrowth rates, then a level, a share of stores, then stores over three years old | Price measurePricing per sq ft; achieved rate on occupied space in FY22 | Year end31 July |
| SSA UK report | Occupancy measureAll stores, over lettable area (current where stated); a survey sample | Price measurePrice per sq ft; the label changes by edition | Year endCalendar year |
Occupancy over MLA counts space that is not yet fitted out in the divisor, and occupancy over CLA leaves it out. The SSA’s 2018 edition says new stores added to its survey “increased the difference between the MLA and CLA”, which lowers the MLA figure and raises the CLA figure.
In the 2020 edition’s tables, CLA less MLA is 6.1 points for 2013 (68.7% against 62.6%) and 11.8 points for 2019 (76.2% against 64.4%). Across 2011 to 2015 it runs from 5.0 to 6.1 points, and across 2017 to 2019 from 9.4 to 11.8 (our calculation). For 2016 it is 2.4 points there, against 4.3 in the 2017 edition (75.8% against 71.5%).
The SSA’s mature-store measure changes by edition too, from stores open for more than six years in the 2014 to 2017 editions to stores with no new space or opening in the last four years in the 2025 and 2026 editions.
The SSA’s figures are survey results, not a count of every store. The editions that state a sample give 57 to 80 companies and 403 to 760 stores. Their coverage wording runs from over 40% of sites in 2014 to “around a quarter” of stores in 2022 to 2024.
From the 2020 edition the SSA says its data set is slightly weighted to larger operators, because fewer small independent operators complete the survey. On 17 October 2026 we found no number of operator companies or stores for the 2026 edition’s operator survey.
Each company’s estate has its own shape. Big Yellow says 75% of its stores, by revenue, are in London and its commuter towns. Safestore had 62 of its 108 UK stores in London and the South East for FY17 and 78 of 139 for FY25, and says 63% of its UK revenue came from them in its FY23 announcement.
Revenue per available square foot, which Safestore calls “REVPAF”, divides revenue by available square feet, not occupied ones, so it is not a price per occupied square foot. Safestore printed its FY24 UK figure for it as £28.00 in the FY24 announcement and £28.85 in the FY25 announcement.
When did a series change its basis?
Big Yellow changed what its series counts or divides by in FY18, FY22 and FY23, Safestore in FY18 and FY25, the SSA its price label in six editions and Lok’nStore its measure in FY21, FY22 and FY23. The list dates each change by the period it first appears in.
- Big Yellow, FY18. The FY18 report printed 81.0% on capacity of 4,606,000 sq ft. The FY19 report gave the FY18 capacity as 4,631,000 sq ft and the occupancy as 80.5%, on the same 3,730,000 sq ft occupied.
- Big Yellow, FY22. The ten-year table starts to include the 24 Armadillo stores acquired on 1 July 2021. Stores open go from 78 to 105, and MLA from 4,930 to 6,098 thousand sq ft.
- Big Yellow, FY23. A 53,000 sq ft store in Aberdeen was acquired with 39,000 sq ft occupied. Big Yellow’s table footnote says occupancy growth in FY17, FY22 and FY23 includes acquired stores.
- Safestore, 29 July 2016 and 1 November 2017. It acquired Space Maker, then 12 Alligator stores the day after its FY17 year end. It says the two acquisitions added 24 stores to its UK portfolio, and the FY17 count of 108 UK stores leaves the Alligator stores out.
- Safestore, FY25. The announcement leads with occupancy of CLA instead of MLA. For its UK stores that is 79.6% against 77.2% for FY24, and 79.9% against 75.6% for FY25.
- SSA price label, 2014 to 2020. The label varies between editions. It was “average net billed room rate” in 2014 and 2015, “net rental rate pa” in 2017 and “average net room rate” from 2020. The 2016, 2018 and 2019 editions use other wording.
- SSA price label, 2023 to 2026. The 2023 edition’s label is “average net rental returns”. The 2024 chart is titled “return per square foot by region”, the 2025 chart “return per square foot on occupied space ex VAT” and the 2026 tile “average revenue per sq ft”.
- SSA combined headline, 2015 to 2017. The 2017 edition’s headline price of £22.68 combines container-only sites at £12.77 with other sites at £22.97. The 2015 and 2016 editions split their headlines the same way, and on 17 October 2026 we found no such split on the price pages of the 2018, 2019 or 2020 editions.
- SSA 2024 edition, weighted basis. Beside its occupancy and return figures, the 2024 edition notes that this data was “previously calculated on a weighted basis and is now calculated on total occupied space”, and that there “may be some discrepancies with data in previous reports”. On 17 October 2026 it was the only note of this kind that we found in the 2018 to 2026 editions.
- Lok’nStore, FY18 to FY23. Its reports give growth rates, then a level, then a share of stores, then stores over three years old, and name the price differently in FY22 and FY23 (see the table above).
Did the industry survey restate its own figures?
Later editions of the SSA UK annual industry report printed different values for the same year in several cases, and on 17 October 2026 the only note we found that says why is in its 2024 edition. That note says the data is now calculated on total occupied space, where it was previously calculated on a weighted basis, and adds that “there may be some discrepancies with data in previous reports”.
The table gives seven cases, each as printed, with our calculation of the difference. For 2022 the 2023 edition said occupancy stayed stable at 83.3%, and the 2024 edition’s chart gave 80.0%. The 2024 edition’s own text says occupancy dropped 2.5 percentage points in 2023 and 5.8 over two years. Those are the differences between 80.0% for 2022, 77.5% for 2023 and 83.3% for 2021, so that edition uses the lower value for 2022 (our calculation).
A different base also changes the size of a move. The 2018 edition puts its 76.1% for 2017 at 2.2 points above a 2016 base of 73.9%. On the 75.8% that the 2017 edition printed for 2016, the same step would be 0.3 points (our calculation).
The 2025 edition’s headline, up 6% to £29.13, implies a 2023 base of about £27.48 (our calculation: 29.13 divided by 1.06), against the £26.23 that the 2024 edition printed for 2023, so the headline percentage and the printed levels do not agree.
The 2026 edition prints the 2025 change in revenue per square foot three ways. The headline tile and one paragraph give a fall of 5.1%, from £28.87 to £27.40, another paragraph gives a fall of 5.4%, and the regional section gives a fall of 7.4% to £26.97 for what it calls the UK average. Our calculation gives 5.1% for £28.87 to £27.40, and 7.4% for £29.13 to £26.97. The edition gives mature-store occupancy for 2025 as 79.6%, 79.1% and 80%.
On 17 October 2026 we found no wording in the 2018 to 2023 and 2025 editions, or in the 2026 edition’s captured text, saying that earlier figures were restated, recalculated or revised. A registration form on another page also offers the 2026 report. We did not complete it, so whether the document it releases states the basis of the £27.40 is unconfirmed.
| Measure and data year | Earlier edition | Later edition | Difference (our calculation) |
|---|---|---|---|
| All-store occupancy, 2016 | Earlier edition75.8% (2017 edition) | Later edition73.9% (2018 edition) | Difference (our calculation)Down 1.9 points |
| All-store occupancy, 2022 | Earlier edition83.3% (2023 edition) | Later edition80.0% (2024 edition) | Difference (our calculation)Down 3.3 points |
| All-store occupancy, 2023 | Earlier edition77.5% (2024 edition) | Later edition75.9% (2026 edition); 76% in the 2025 edition | Difference (our calculation)Down 1.6 points |
| Price per sq ft, 2019 | Earlier edition£22.82 (2020 edition) | Later edition£23.08 (2021 edition) | Difference (our calculation)Up £0.26 |
| Price per sq ft, 2021 | Earlier edition£26.13 (2022 edition) | Later edition£26.16 (2023 edition) | Difference (our calculation)Up £0.03 |
| Price per sq ft, 2022 | Earlier edition£27.19 (2023 edition) | Later edition£25.97 (2024 edition) | Difference (our calculation)Down £1.22 (4.5%) |
| Price per sq ft, 2024 | Earlier edition£29.13 (2025 edition) | Later edition£28.87 (2026 edition) | Difference (our calculation)Down £0.26 |
SSA UK annual industry report, editions 2017 to 2026: all-store occupancy, and UK price per square foot per year. Each difference is our calculation. The price label changes between editions. Read 17 October 2026.
Which years can you compare?
In this guide a run of years is a run only inside one source, one perimeter of stores and one definition. This guide joins no two sources into one line or one average, and it offers no cross-source series.
Big Yellow has two runs by perimeter, before and after the 24 Armadillo stores. Safestore’s occupancy on MLA to FY24 also has two runs, before and after the 12 Alligator stores join its count in FY18. For the SSA, this guide reads one edition at a time: its longest run in a single edition is 2013 to 2024 in the 2025 edition, in whole numbers. The table names what breaks each run.
For Safestore’s average storage rate, the announcements name a break in FY17 and FY18. As at 17 October 2026 we had not searched the text of the other years for similar wording, so the FY19 to FY25 run in the table is a run with no break named in the rows we read, not a run with no break.
| Source and measure | Year end | Comparable run | What breaks it |
|---|---|---|---|
| Big Yellow occupancy and price | Year end31 March | Comparable runFY17 to FY21 (73 to 78 stores); FY22 to FY26 (105 to 113 stores) | What breaks itFY22: 24 Armadillo stores enter; FY18: capacity printed differently next year |
| Safestore UK occupancy | Year end31 October | Comparable runFY16 to FY17 and FY18 to FY24 in the rows read, on maximum lettable area | What breaks itFY18: 12 Alligator stores join; FY25: lead basis becomes current lettable area |
| Safestore UK average storage rate | Year end31 October | Comparable runFY19 to FY25 in the rows read, with a like-for-like rate beside each year | What breaks itFY17 and FY18: Safestore names immature and acquired stores |
| Lok’nStore occupancy and price | Year end31 July | Comparable runPrice levels for FY22 and FY23 under two labels; no occupancy run | What breaks itThe measure changes in FY21, FY22 and FY23; the series read ends with FY23 |
| SSA UK all-store occupancy | Year endCalendar year | Comparable runOne edition at a time | What breaks itLater editions printed other values for 2016, 2022 and 2023 |
| SSA UK price per square foot | Year endCalendar year | Comparable runOne edition at a time | What breaks itThe label changes in six editions; other values printed for 2019, 2021, 2022 and 2024 |
Big Yellow Group, Safestore Holdings and Lok’nStore Group results and reports; SSA UK annual industry report, editions 2014 to 2026. Our reading of where each run breaks. Read 17 October 2026.
What do these numbers not tell a new operator?
They are the figures of named operators’ own estates and of a survey sample, averaged over many stores of many ages. None is the figure for a single store, a new store or a single town.
Big Yellow’s 12 “lease-up” stores, which we read as stores still filling, were 49.2% occupied at 31 March 2026 and its 77 same stores 78.2%, against 74.2% for all 113 stores. A group figure averages stores at very different levels of occupancy.
Our guide to how long a store takes to fill sets out what operators say about stores still filling. Our self storage KPIs guide sets out what each KPI divides by, with the published figure where there is one. Our guide to who uses self storage in the UK sets out what the surveys say about households, businesses and length of stay.
Our guide to whether self storage is profitable in the UK prints some of the same published figures. So does our guide to self storage investment in the UK.
What does this guide not cover?
- Years before the ones read. We read Big Yellow from FY17, Safestore from FY16, Lok’nStore from FY18 and the SSA UK editions from 2014. The SSA’s landing page lists earlier reports back to 2004 to 2005, which we did not read.
- Safestore FY16. We read the FY16 values as the prior-year column of the FY17 announcement, not the FY16 announcement itself.
- Lok’nStore after the year to 31 July 2023. On 17 October 2026 the archive page lists no later annual report, and we did not search any other list of company announcements.
- Wales and Northern Ireland. The SSA groups Wales with the West Midlands as “West Midlands & Wales” in its regional charts from the 2015 edition. On 17 October 2026 we found no occupancy or price row for Northern Ireland in its 2015 to 2026 editions. This guide prints no regional values. We did not check whether Big Yellow or Safestore split their figures by nation.
- What happens next. This guide makes no forecast.
- Revenue per available square foot. It is a different measure from a price per occupied square foot, and this guide does not show it as one.
- Second copies of an edition. Some editions exist as more than one PDF file. For the 2022 to 2025 editions we read the file on the SSA UK site only, and we did not look for second copies of earlier editions.
- The 2026 report document behind a registration form. We read the 2026 edition’s interactive text, its landing page and its press release, and on 17 October 2026 we found no link to a PDF of it on the SSA’s 2026 report page.
- Other sources. We read these four sources only. Other operators’ figures and other surveys are outside this guide.
Sources
All read on 17 October 2026.
- Big Yellow Group, preliminary announcement for the year to 31 March 2026, 18 May 2026, and its investor page with the ten-year summary.
- Big Yellow Group annual reports for the years to 31 March: 2018, 2019, 2020, 2021, 2022, 2023, 2024 and 2025.
- Safestore Holdings results announcements for the years to 31 October: 2017 (9 January 2018), 2018 (8 January 2019), 2019 (7 January 2020), 2020 (14 January 2021) and 2021 (13 January 2022).
- Safestore Holdings results announcements, continued: 2022 (17 January 2023), 2023 (17 January 2024), 2024 (16 January 2025) and 2025 (15 January 2026).
- Safestore Holdings investor pages: Five Year Record, Key Performance Indicators and Financial Highlights.
- Lok’nStore Group annual reports for the years to 31 July: 2018, 2019, 2020, 2021, 2022 and 2023.
- Lok’nStore Group, reports and presentations archive page.
- The SSA UK annual industry report, 2014 edition, linked.
- The SSA UK annual industry report, 2015 edition, linked.
- The SSA UK annual industry report, 2016 edition, linked.
- The SSA UK annual industry report, 2017 edition, linked.
- The SSA UK annual industry report, 2018 edition, linked.
- The SSA UK annual industry report, 2019 edition, linked.
- The SSA UK annual industry report, 2020 edition, linked.
- The SSA UK annual industry report, 2021 edition, linked.
- The SSA UK annual industry report, 2022 edition, linked.
- The SSA UK annual industry report, 2023 edition, linked.
- The SSA UK annual industry report, 2024 edition, linked.
- The SSA UK annual industry report, 2025 edition, linked.
- The Self Storage Association UK’s 2026 interactive report with Cushman & Wakefield, linked.
- The Self Storage Association UK’s 2026 industry report page and press release of 29 April 2026.
FAQs
What is the average occupancy of a self storage facility in the UK?
Each source answers it differently, because each counts its own stores on its own divisor. As at 17 October 2026, the SSA UK 2026 edition’s text gives all-store occupancy of 74.5% for 2025, from a survey of operators. Big Yellow’s results give 74.2% at 31 March 2026, and Safestore’s UK occupancy was 75.6% of maximum lettable area (79.9% of current lettable area) at 31 October 2025. This guide calls none of them a UK average.
What is the average price per square foot for self storage in the UK?
It depends on whose figure it is, because each source measures price on its own basis. As at 17 October 2026, the SSA UK 2026 edition gives revenue per square foot of £27.40 ex VAT for 2025, from a survey sample. Big Yellow’s closing price was £36.28 per square foot at 31 March 2026. Safestore’s UK average storage rate was £30.68 for the year to 31 October 2025. This guide calls none of them a UK average.
Has self storage occupancy fallen since 2021?
On each source’s own basis the latest figure is lower than the 2021 one. The SSA UK 2026 edition’s text gives all-store occupancy of 83.3% for 2021 and 74.5% for 2025. By our calculation Big Yellow’s went from 85.2% at 31 March 2021 to 74.2% at 31 March 2026. Safestore’s UK occupancy of maximum lettable area went from 85.4% for the year to 31 October 2021 to 75.6% for 2025. The three count different stores on different divisors.
What do MLA and CLA mean in self storage?
The SSA UK annual industry report’s 2018 edition describes MLA as maximum lettable area, which includes space yet to be fitted out, and CLA as current lettable area, the space currently available to customers. Safestore says CLA leaves out space not yet fitted out and space that is operationally unavailable. For its UK stores at 31 October 2025 Safestore gave 75.6% of MLA and 79.9% of CLA, a gap of 4.3 points from the divisor alone (our calculation).
Why do the SSA’s figures change between editions?
Later editions printed different values for some earlier years, for example all-store occupancy of 83.3% and then 80.0% for 2022. On 17 October 2026 the only reason we found printed is a note in the 2024 edition, which says its data was previously calculated on a weighted basis and is now calculated on total occupied space, and that there may be some discrepancies with data in previous reports. The note sits beside that edition’s occupancy and return figures, and adds that there may be some discrepancies with data in previous reports.
Is the SSA’s occupancy figure for every UK store?
No, it comes from a survey of operators. The editions that state a sample give 57 to 80 companies and 403 to 760 stores. From the 2020 edition the SSA says its data set is slightly weighted to larger operators, because fewer small independent operators complete the survey. On 17 October 2026 we found no number of operator companies or stores for the 2026 edition.
Do Big Yellow, Safestore and the SSA measure price the same way?
No. Big Yellow’s closing measure is annual storage revenue from in-place customers divided by occupied space at the balance sheet date. Safestore’s average storage rate is revenue from self-storage divided by the average square feet occupied in the period. The SSA changed its label for the price measure in its 2016, 2020, 2023, 2024, 2025 and 2026 editions, and its 2025 chart title names occupied space and VAT.
Phil McParlane, Founder, StoreBay
Phil is the founder of StoreBay, the UK self-storage management platform. He writes about starting, running and growing storage businesses — the operational detail, not the fluff. About StoreBay
Keep reading
Self storage KPIs for UK operators: 12 numbers and what each divides by
Occupancy, REVPAF, churn, conversion and more: the 12 self storage KPIs, what each divides by, and the figures UK operators and the SSA publish for them.
How long does a new self storage store take to fill? What UK operators report

UK self storage seasonality: what the public data shows

Self storage pricing strategy: fill units and grow revenue